
WEEKLY WEALTH REPORT
.png)
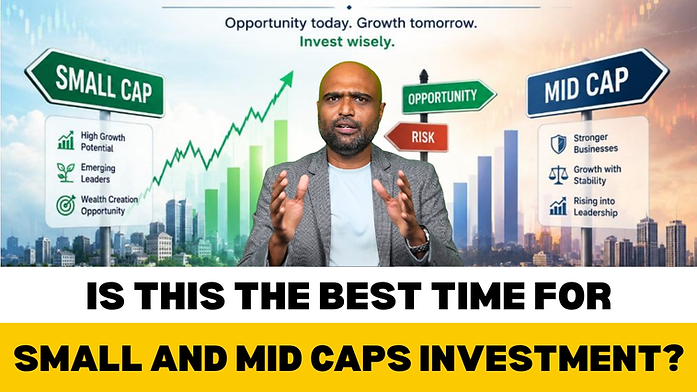
Mid & Small Caps Are Back. But Here's the Bigger Story. The latest AMFI data shows a clear shift in investor sentiment:
Mid & Small Cap mutual funds attracted ₹11,692 crore in June 2026.
SIP collections reached another record high.
Inflows into midcaps were nearly 30% above their 12-month average.
Does this mean the rally is back in Mid and Small Caps? Maybe. But that's not the most important takeaway. Markets move in cycles.
Since January 2026, the BSE Small Cap 250 Index has delivered a return of 6.8%, while the BSE Mid Cap Index has returned 3.01%. In contrast, the Large Cap Index has declined by 9.82% during the same period.
`
Small-cap indices delivered their strongest monthly performance in nearly 14 years, while mid-caps recorded their best gains in six years—signalling renewed investor confidence in the broader market.
This rally has come after a long pause in small cap segment since Sep 2024, The Small Cap Index fell around 9% in Callender year 2025. Since that correction nearly 66% of Small Cap Stocks has fallen.
The small-cap space has not really moved for about one to one-and-a-half years. The recent environment reflects both time and price correction, a combination, investors rarely see together and making this as a compulsive timing to re-enter. The idea is not to rush in, but to re-enter thoughtfully.
Many sunrise sectors such as aerospace, electronics manufacturing, EV ecosystems, renewables and advanced pharma are more accessible in the Mid and small-cap universe alone. For long-horizon investors, corrections may allow entry into these themes at more reasonable valuations.”
If your goals are Five to Seven years away, they deserve a place. But if a 20 percent drawdown (correction) disturbs your sleep, this category isn’t for you.
WEEKLY MARKET PULSE
Indian equity benchmarks snapped their four-week winning streak, posting mild weekly losses due to escalating tensions in the Middle East and rising crude oil prices. However, the markets staged a strong recovery on Friday, paring earlier losses.
Index Movements: The Nifty 50 ended the week at 24,211.65 ( -0.24% ) and the BSE Sensex at 77,593.11 ( -0.22% )
Foreign Investors return to India in July is a reviewal. July sees $ 2.6 Bn Inflows in Indian Equities.
This reversal is a shift from AI and Semiconductors from Korea and Taiwan after the concerns of Valuation
Friday Relief Rally: A strong rebound on Friday—led by easing oil prices and a weaker dollar—helped the benchmarks significantly trim their weekly losses.
Strong rally on Friday after TCS delivered in-line Q1 results, boosting sentiment in IT stocks.
Top Gainers – IT, Financial Services and Realty are the Top Perfroming Sectors for the week.
Top Losers – FMCG and Select Defensive Stocks were top losers

PRODUCT OF THE WEEK
INVESCO INDIA SMALL CAP FUND

The Invesco India Small Cap Fund is a high-risk equity mutual fund tailored for long-term capital appreciation by investing predominantly in smaller, agile companies. It is an open-ended fund that has generated strong historical returns.
Portfolio & Strategy
Sector Focus: Highly diversified with heavy weightings in Consumer Durables, Auto Components, Financials, and Healthcare Services .
Market Cap Allocation: The fund invests roughly 65% strictly in small-caps, while selectively utilizing large-cap (~14%) and mid-cap (~18%) stocks for better risk management and stability .
Stock Picking: It focuses on finding market disruptors and businesses with high growth potential, often in sunrise or niche industries.

THIS WEEK MY TOP SOCIAL MEDIA CONTENTS

“Start investing early. We hear it all the time. But how much difference can 5 years really make?
Let’s take a simple example:
Rohit starts at 25. Nandhini starts at 30.
Both invest ₹10,000/month at an assumed 12% annual return and stop at 45.
At 45:
Rohit
Invests for 20 years
Invests ₹24 lakh
Corpus: ~₹99 lakh
Nandhini
Invests for 15 years
Invests ₹18 lakh
Corpus: ~₹50 lakh
Difference: ~₹49 lakh
Rohit invested only ₹6 lakh more, but ended up with almost ₹49 lakh more.
Why?
Not a higher income. Not a bigger SIP. Just 5 extra years of compounding.
Your income can grow later. Your SIP can increase later. But you can never get back lost time.
Start early. Stay consistent. Let compounding do the heavy lifting.
ALL YOU WANT TO LEARN ABOUT
MUTUAL FUNDS
KICKSTART YOUR INVESTMENTJOURNEY OF 2026
FROM HERE
Describe one of your services

STOCK MARKET
KICKSTART YOUR INVESTMENTJOURNEY OF 2026
FROM HERE
Describe one of your services

What You Will Learn:
1. A-z Of Mutual Funds
2. Master The Art Of Sip’s
3. Build Wealth Like A Pro
4. Recorded Session Contains 8 Chapters
In Tamil Language
5. Lifetime Access
MIDDLE CLASS TO MILLION DOLLAR

Key Highlights:
1. Key Entry And Exit Points Of The Stock Market
2. 6-point Filter To Select A High-performing Stock
3. Learn Macro-economic Trends In Stock Picking
TO BUY MY UNTOLD WEALTH SECRET

This Newsletter Is From Creating Wealth Company – For Private Circulation Only.
For More Information Connect With Sathish Kumar @ 9841058689.
You Can Also Connect With Us investments@sathishspeaks.com | Visit Us – www.sathishspeaks.com for More Details.
DISCLAIMER
Mutual Funds and Stock Market Investments are subject to market risks, pls read all scheme related documents carefully. Past performance of the mutual fund is not necessarily indicative for future performances. Mutual fund does not guarantee any returns or dividends.
This report is for informational purpose only and contains information, opinion, material obtained from reliable sources and every effort has been made to avoid errors and omissions and is not to be construed as an advice or an offer to act on views expressed therein or an offer to buy and/or sell any securities or related financial instruments, we shall not be responsible and/or liable to anyone for any direct or consequential use of the contents thereof. Reproduction of the contents of this report in any form or by any means are prohibited.